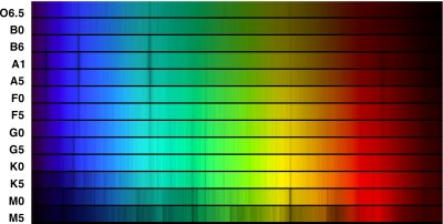
In the late nineteenth century, we had collected enough photographs of stellar spectra to realize the
need to classify them. This task was accomplished by Annie J. Cannon at the Harvard Observatory. After
sorting through thousands of images like this one of these spectra, she finally arrived at a sequence of just
seven types designated by the letters, O B A F G K M. How did we end up with that odd sequence of
letters? The famous way to remember this sequence is Oh, be a fine girl kiss me. There is even a song,
apparently. Can you come up with your own mnemonic?
The modern classification system is a bit more complicated than the original seven types. There are specific
rules for designating a star as one type or another. Each spectral type has a specific temperature and luminosity.
We have special designations for white dwarfs, for example. There are also luminosity classes which differentiate between red dwarfs and red
giants, both of which have essentially the same surface temperature and color index. The color indices for stars range from about -0.3 to +1.7,
depending on the spectral type. There is also a somewhat precise way to use color index to calculate the temperature of a star.
Soon, it became obvious that we should plot the spectral type of a star and its luminosity, or brightness. The result was the Hertzsprung-Russell
diagram.
Looking for a particular star? Find it here!


